Paradigm Weekly 35: $BTC, $HIGH and TradFi sentiment check.
Hey Shifter, welcome to another edition of Paradigm Weekly! This week, we're diving into the impressive performance of HIGHUSDT, analyzing Bitcoin's potential inverse Head and Shoulders pattern, and recapping a fun and educational challenge involving a short on $WTI (Oil).
Plus, we'll touch on the recent all-time highs in $SPX, $NDX, and $DJIA. Let’s get into the details and see what’s shaping the markets this week.
A Closer Look at HIGHUSDT
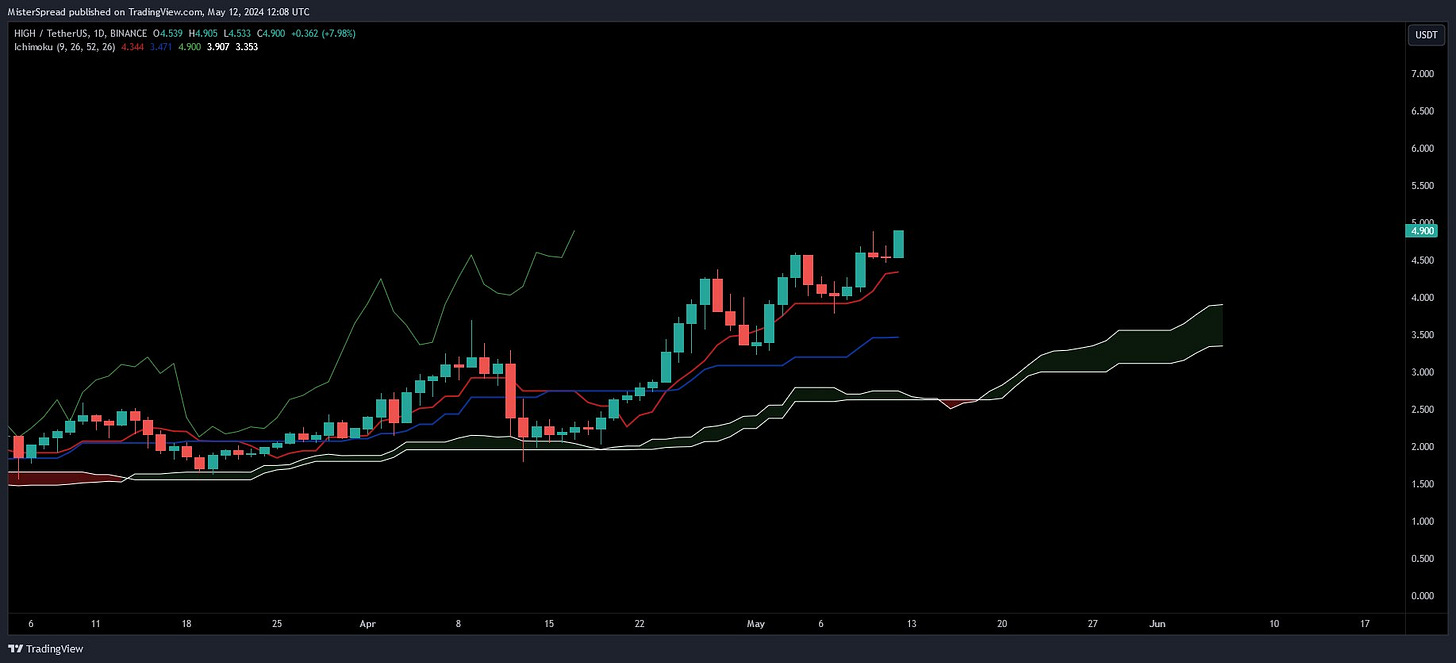
Ichimoku Insights on HIGH
First off, let's talk about the signals from Ichimoku on both the daily and weekly charts. The price staying above the Kumo (cloud) points to bullish conditions, and the fact that the conversion line (Tenkan) is also above the baseline (Kijun) and the cloud adds to the bullish stance.
This alignment suggests strong momentum, particularly as the lagging span stays clear above the price and the cloud, enhancing our bullish outlook.
It’s noteworthy how HIGH has performed, even when Bitcoin and many altcoins faced downward pressure.
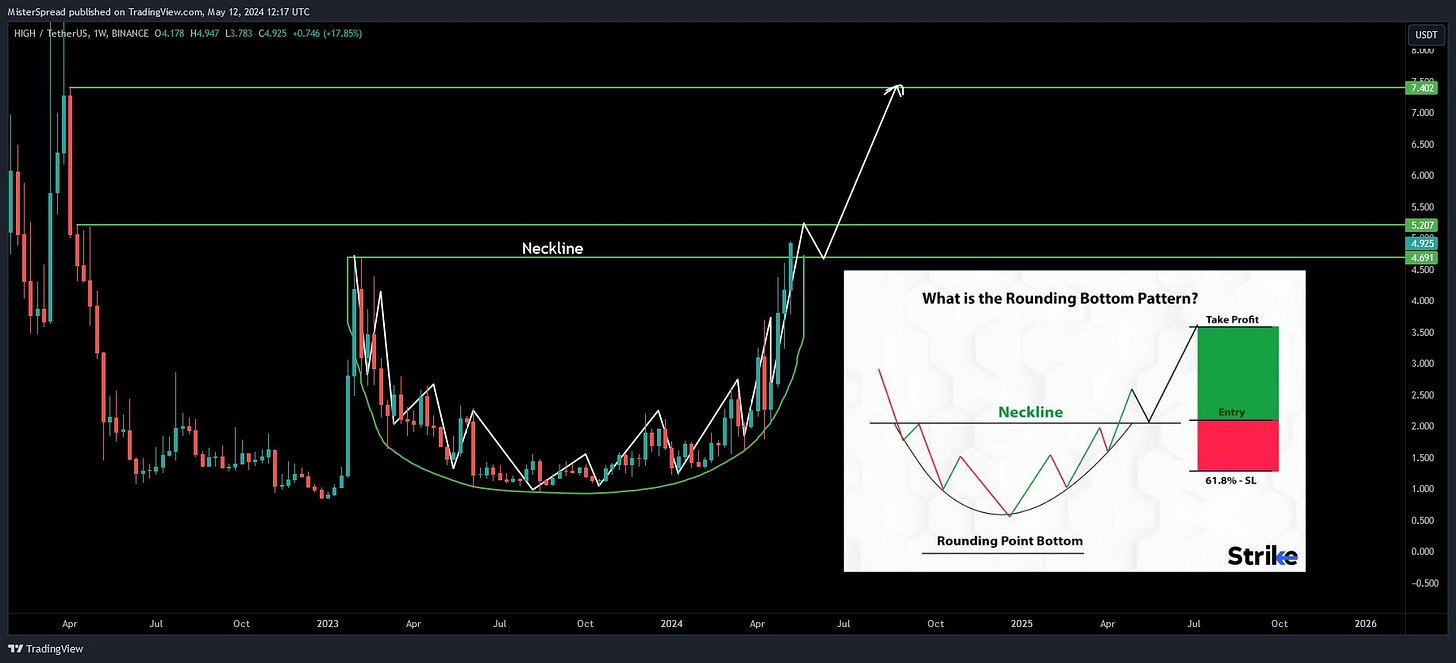
Rounding Bottom Pattern on HIGH
On a more serious note, after I cleared the chart I can even see a textbook "Rounding Bottom" pattern. If buyers will be able to break and close above $4.682 on weekly and continue higher, then the $5.20 and $7.4 areas are opened. Credits to StrikeMoney for the pattern.
Remember, markets & especially crypto markets can be tricky, so you have to understand market structures & being prepared for volatility, which, as discussed, is often a stepping stone to higher prices if the key support levels hold.
Even if this analysis / video were done with Ichimoku, please remember that I ALWAYS start my analysis with Price, Price Action and Market Structure and only after I add my Indicator of choice - Ichimoku in my case.
Price Action is King and ALL indicators are secondary!
Bitcoin
Bitcoin's Inverse Head and Shoulders Pattern: A Closer Look
Everyone seems to be eyeing Bitcoin with anticipation, expecting a move down to the $52k-$54k range. However, the current chart pattern might just surprise everyone. An inverse Head and Shoulders (HnS) pattern is forming, and it could significantly alter the course if it plays out as expected.
Pattern Dynamics and Key Levels
This inverse HnS pattern, a classic reversal setup, suggests a potential change in trend from bearish to bullish. For confirmation of this pattern, we need to see Bitcoin's price rise above $65k, which serves as the neckline of this formation. If we can achieve a continuation above $67k, it would further validate the bullish signal. On the flip side, the pattern would be invalidated if Bitcoin closes under $58k on a daily basis and continues lower.
Current Status of the Pattern
So far, so good. Bitcoin has successfully printed the second shoulder of the inverse HnS, and buyers have indeed stepped up to the challenge. Having achieved the daily close above the $65k area, which is crucial as it acts as the neckline of this pattern, it's now imperative for buyers to maintain the price above this level to sustain the bullish momentum.
Challenge Recap: Why I Shorted Oil and the $100 Bitcoin Prize
Last week, in the midst of quieter market days due to various bank holidays across Europe, I decided to add a bit of excitement to our trading activities by initiating a short on $WTI (Oil).
To make our interactions even more engaging, I introduced a challenge that not only sparked discussion but also offered a reward.
I shorted Oil and posed a challenge to our community: provide the best and easiest explanation of why I chose to short Oil based on the chart I shared. The incentive? $100 in Bitcoin for the most insightful explanation.
The challenge was set to last 24 hours from the announcement, encouraging participants to quickly analyze, respond, and engage with their own charts and explanations.
Update on the Oil Short Position
Congratulations are in order for those who joined me in shorting Oil last week. It was a nail-biter, coming just cents away from the stop loss, but thankfully, the trade remains live and profitable. In response to the market movement, I've moved the stop loss to break-even and will continue to trail stop it to secure our gains.
This experience was not only profitable but also educational. Participants provided great insights, demonstrating their understanding of market dynamics and trading strategies.
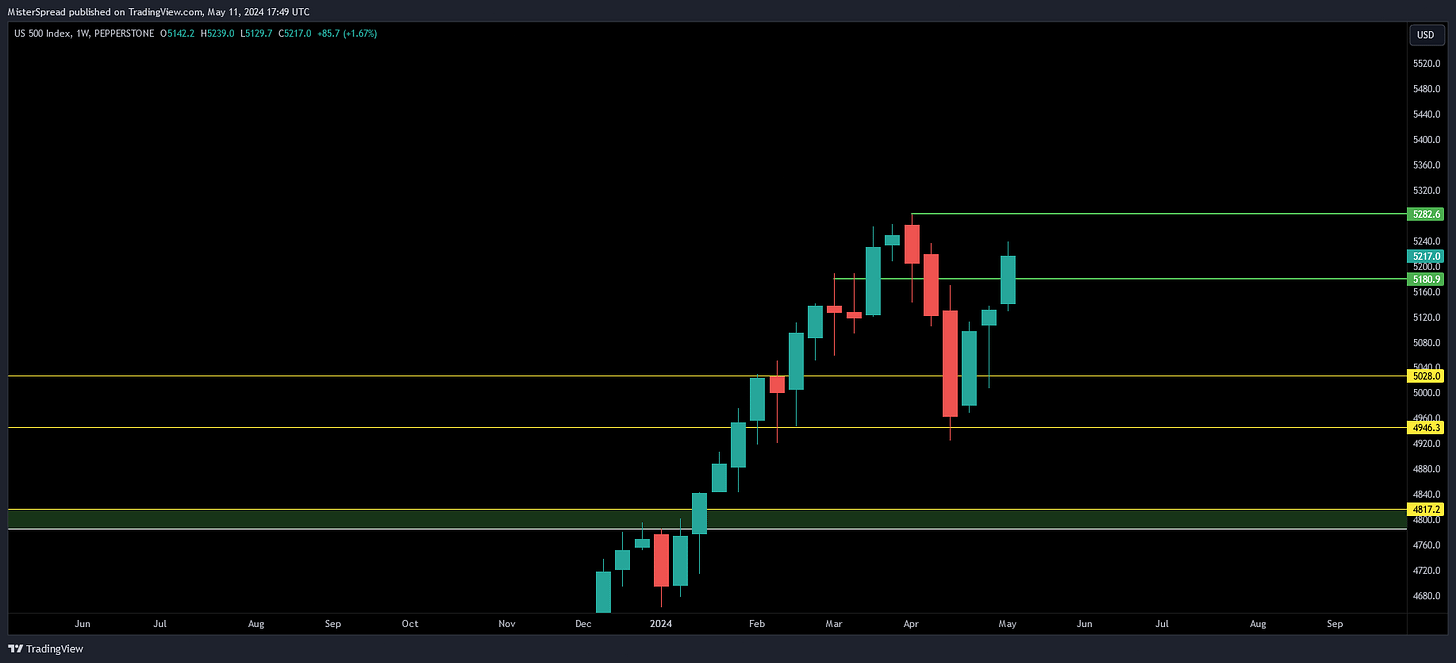
$SPX $NDX $DJIA all hitting new ATHs
TradFi sentiment check:
$SPX - 1% from a new All Time-High
$NDX - 1% from a new All Time-High
$DJIA - 0.80% from a new All Time-High
I know most of the times debates around here are quite heated, but let's try it one more time.
Base on the current charts & from a TA perspective, what am I missing? what's bearish?
Market Response and New Highs
Just two days after posing this question, the market responded decisively, with $SPX, $NDX, and even $DJIA all hitting new all-time highs (ATHs). This outcome served as a real-time lesson in market dynamics and the importance of being responsive rather than predictive.
Lessons in Price Action
Study Price Action: Understanding the actual movements in market prices can provide clearer insights than speculative predictions.
React to Price & Let It Lead: Instead of trying to lead the market with our biases, letting the price action guide our decisions can lead to more successful outcomes.
Embrace #ParadigmShift: This approach involves continuously learning and
As we move forward, keep these principles in mind. The markets have a way of humbling even the most confident predictions, reminding us that our strategies must be dynamic and responsive to real-time data.
Remember: Study Price Action and let it lead.
Conclusion
As we wrap up this edition, it's clear that the markets are offering plenty of opportunities and lessons. Whether it's the bullish signals on HIGHUSDT, the critical levels for Bitcoin, or the insights gained from our oil short challenge, staying informed and adaptable is key.
Remember to study price action, react to market movements, and let data guide your decisions. Until next week, keep learning and trading smart!
Join ParadigmShift for:
Exclusive Discord Access: Dive into @MisterSpread’s analysis, trades, and community dialogues
Learning Materials: Elevate your trading knowledge
Weekly Highlights: Macro analysis (DXY, SP500, BTC, ETH) and community-voted ALTS deep dives
Engage & Learn: Weekly AMAs on crypto trading, market conditions, and mindset
LIVE Sessions: Thrice-monthly on-the-spot charting
Monthly Book Club: Delve into trading, investing, and mindset literature
Exclusive Perks: Discounts from ParadigmShift partners and firsthand access to projects
Join Paradigm Shift : https://www.patreon.com/PShift


